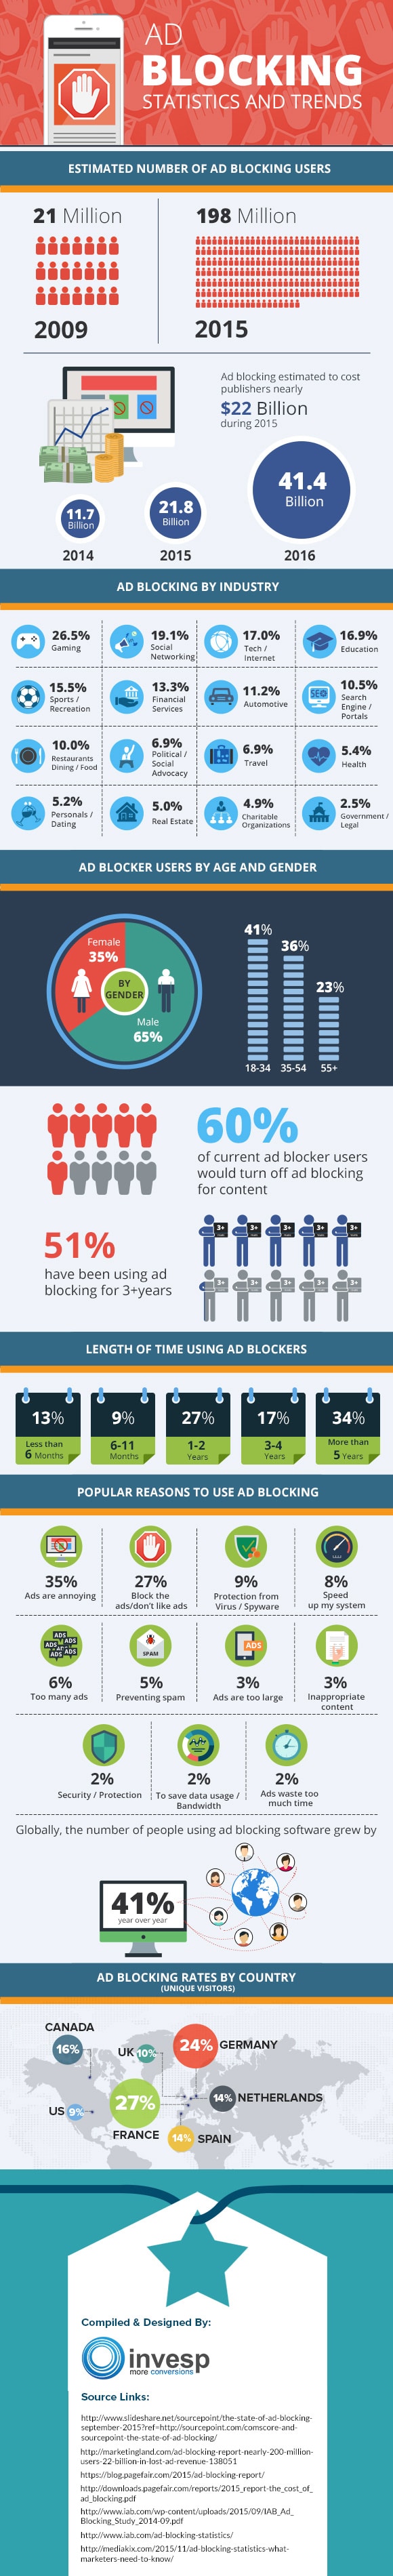
Ad blocking has grown from roughly 21 million users in 2009 to 198 million active global users as of June 2015 and is estimated to cost publishers nearly $22 billion during 2015. Check out our infographic on Ad Blocking for latest ad blocking statistics and trends.
Infographic by- Invesp Conversion Optimization
To Publish this Image on your Blog or Website . Copy this code
Estimated Ad Blocking Cost (in Billions)
| Year | Estimated cost ( in Billion) |
| 2014 | 11.7 |
| 2015 | 21.8 |
| 2016 | 41.4 |
Ad Blocking by Industry
| Industry | %age |
| Gaming | 26.5% |
| Social Networking | 19.1% |
| Tech / Internet | 17.0% |
| Education | 16.9% |
| Sports / Recreation | 15.5% |
| Financial Services | 13.3% |
| Automotive | 11.2% |
| Search Engine / Portals | 10.5% |
| Restaurants Dining / Food | 10.0% |
| Political / Social Advocacy | 6.9% |
| Travel | 6.9% |
| Health | 5.4% |
| Personals / Dating | 5.2% |
| Real Estate | 5.0% |
| Charitable Organizations | 4.9% |
| Government / Legal | 2.5% |
Ad blocker users by Age and Gender
By Gender
| By Gender | %age |
| Male | 65% |
| Female | 35% |
By Age
| By Age | %age |
| 18-34 | 41% |
| 35-54 | 36% |
| 55+ | 23% |
60% of current ad blocker users would turn off ad blocking for content
51% have been using ad blocking for 3+ years
Length of time using ad blockers
| Length of time | %age |
| Less than 6 months | 13% |
| 6-11 months | 9% |
| 1-2 Years | 27% |
| 3-4 Years | 17% |
| More than 5 Years | 34% |
Popular reasons to use Ad Blocking
| Reasons | %age |
| Ads are annoying | 35% |
| Block the ads/don’t like ads | 27% |
| Protection from Virus / Spyware | 9% |
| Speed up my system | 8% |
| Too many ads | 6% |
| Preventing spam | 5% |
| Ads are too large | 3% |
| Inappropriate content | 3% |
| Security / Protection | 2% |
| To save data usage / Bandwidth | 2% |
| Ads waste too much time | 2% |
Globally, the number of people using ad blocking software grew by 41% year over year
Ad blocking rates by country (Unique Visitors)
| Country | %age |
| France | 27% |
| Germany | 24% |
| Canada | 16% |
| Spain | 14% |
| Netherlands | 14% |
| UK | 10% |
| US | 9% |